2026 Top Water Analysis Equipment Types for Buyers?
Choosing water analysis equipment in 2026 requires more than comparing prices and product photos. Buyers must match each instrument to the sample, contaminant, detection limit, and operating environment.
A municipal laboratory may need an ion chromatograph for nitrate, fluoride, and sulfate testing. A food plant may prefer a compact pH meter, conductivity meter, and turbidity analyzer. Field teams often need portable photometers, dissolved oxygen meters, and multiparameter probes. Each tool answers a different question. None is perfect.
Peter Gleick, a leading water researcher and co-founder of the Pacific Institute, has stated, “Water is a human right.” That principle gives water analysis a deeper purpose. Reliable measurements help protect public health, improve treatment decisions, and identify pollution before it becomes visible. They also support defensible records during audits and quality investigations.
This guide examines the top water analysis equipment types for buyers in 2026. It considers accuracy, calibration effort, sample throughput, automation, maintenance, and total ownership cost. It also explains where laboratory instruments outperform field devices, and where portability matters more than extreme sensitivity.
The practical details matter. A probe left wet with residue can drift. A neglected calibration standard can weaken confidence. These issues seem small. They are not.
Some recommendations will depend on assumptions about your water source and testing frequency. Buyers should challenge those assumptions before ordering. The most expensive analyzer may be unnecessary, while a cheap meter may create costly uncertainty. Good water analysis begins with a clear testing plan, not a crowded catalog.
2026 Water Analysis Equipment Map: 2.2 Billion People Lack Safe Water
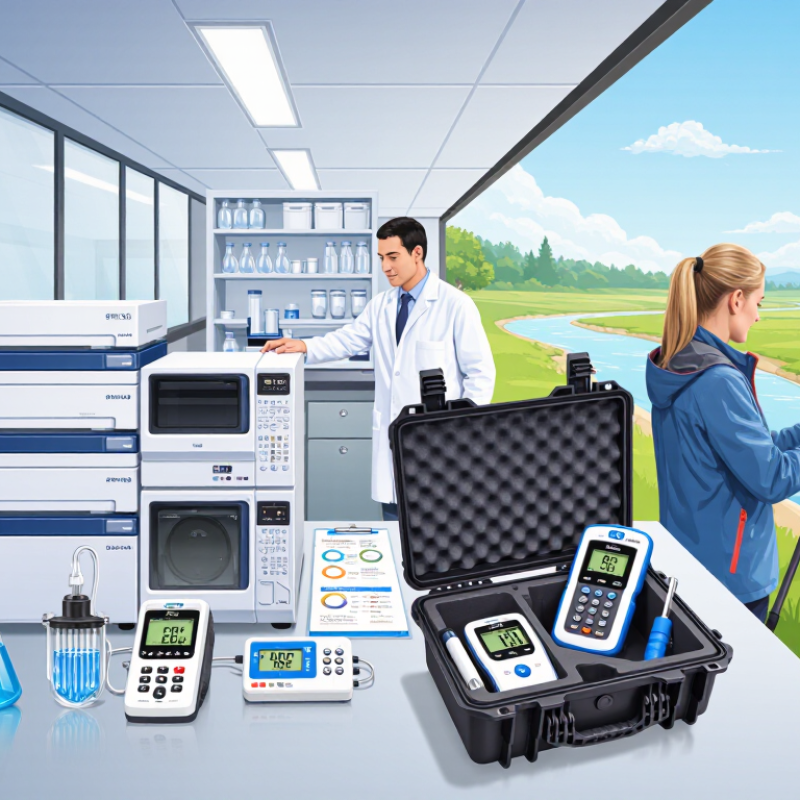
The 2026 water analysis equipment market must be viewed through a human need: about 2.2 billion people lacked safely managed drinking water in the latest widely cited global assessment. That figure is not just a statistic. It can mean a rural household collecting water before sunrise, or a clinic storing samples beside dusty roads. Buyers should connect equipment choices with these conditions.
Portable turbidity meters help reveal suspended particles quickly. pH and conductivity meters support routine chemical screening. Microbiological testing tools can identify contamination risks, while spectrophotometers measure nutrients, metals, and other target compounds.
For remote areas, battery life, sample preservation, calibration support, and simple data records may matter more than a long feature list. A highly precise instrument is still weak if technicians cannot maintain it.
Procurement teams should verify detection limits, method compatibility, quality controls, and local training requirements. Independent validation and documented calibration improve confidence. Yet equipment alone cannot create safe water. Weak sampling methods, seasonal changes, and damaged storage containers can distort results. This is where buyers may need to rethink their plans. The most expensive system is not automatically the most useful. A practical water analysis map should match risk, geography, operator skill, and available maintenance, while leaving room to improve as local evidence grows.
Field Meters: pH, EC, DO and Turbidity—0.01 NTU Resolution Explained
Water analysis equipment buyers in 2026 need more than a long specification sheet. Field meters combining pH, electrical conductivity (EC), dissolved oxygen (DO), and turbidity support faster decisions near tanks, rivers, and treatment sites. pH shows acidity changes, while EC indicates dissolved ionic content. DO helps assess biological conditions. Turbidity reveals suspended particles.
A turbidity meter with 0.01 NTU resolution can display very small changes in clear water. Resolution is not the same as accuracy. Bubbles, scratched vials, sunlight, and colored samples can distort readings. Keep the sample container clean, remove trapped air, and wait for the reading to stabilize. For pH, use fresh calibration solutions and check the electrode after muddy sampling. EC measurements need temperature compensation, but automatic correction can hide unusual temperature effects. DO sensors also require correct calibration and enough water movement.
Tips: Record temperature, location, time, and sample condition with every result. Carry spare batteries and a clean cloth. Test a reference solution during long field days. I have found that rushing calibration creates more trouble than slow sampling. Still, even careful routines can fail in cold weather or heavy rain. Review unexpected values instead of deleting them. A second measurement may expose a handling mistake, or a real water-quality change.
Microbial Testing: Culture vs qPCR Under ISO 9308-1 and EPA Methods
Water analysis buyers in 2026 should separate microbial culture equipment from qPCR platforms. Under ISO 9308-1, membrane filtration concentrates Escherichia coli and coliform bacteria from a measured water volume. The filter is placed on selective medium, incubated, and examined for characteristic colonies. A filtration manifold, sterile holders, incubator, and reliable colony counter remain essential.
Culture provides viable-cell evidence and supports established compliance workflows. However, results may require one to two days, and crowded membranes can complicate counting. ISO 9308-1 also suits waters with relatively low background contamination. It may not fit every wastewater or highly turbid sample. That limitation matters.
qPCR detects target DNA after filtration or concentration, extraction, and amplification. EPA methods differ by organism, sample matrix, controls, and reporting requirements. Buyers should verify the exact method before selecting a thermocycler, extraction system, or fluorescence reader. Faster answers help incident response. They do not automatically prove viability, because DNA can remain after cells lose activity. Include inhibition controls, extraction blanks, positive controls, and calibration checks. Small details matter.
A practical laboratory may use both approaches. Culture can support viable counts, while qPCR can provide earlier screening. Yet the two results are not interchangeable. A positive qPCR signal with no recoverable colonies needs investigation, not an easy conclusion. Sampling volume, holding time, temperature, filtration recovery, and operator technique can change the outcome. Even experienced teams should review assumptions when results disagree.
2026 Water Microbial Testing: Culture vs qPCR
Typical analytical turnaround reported for selected international and U.S. water microbiology methods.
Culture-based methods such as ISO 9308-1 and EPA Method 1603 generally require incubation and colony enumeration, commonly producing results in about 24 hours. EPA Method 1611 uses quantitative PCR for enterococci and can provide results in approximately 4 hours. These methods target different indicator organisms and are not interchangeable without validating the intended regulatory application.
Reference methods: ISO 9308-1:2014; U.S. EPA Method 1603; U.S. EPA Method 1611.
Buyer Matrix: Accuracy, Detection Limits and ISO/IEC 17025 Validation
2026 Top Water Analysis Equipment Types for Buyers?
Buyer Matrix: Accuracy, Detection Limits and ISO/IEC 17025 Validation
Buying water analysis equipment in 2026 requires more than comparing advertised accuracy. A buyer matrix should list method, sample range, repeatability, detection limit, and uncertainty. For a metals analyzer, record results near the reporting limit, not only clean laboratory standards. A reading of 0.010 mg/L may look precise, yet matrix interference can shift the true value. Ask for raw data, calibration records, and recovery results from comparable water samples. Small details matter. Also check temperature control, reagent stability, and cleaning time. These affect daily results.
Detection limits need practical context. A low limit is useful only when blank contamination stays controlled. Compare the method detection limit with your real reporting requirement. Review precision at low, middle, and high concentrations. Then examine whether the instrument supports documented verification after installation. ISO/IEC 17025 validation should cover selectivity, linearity, accuracy, precision, robustness, and measurement uncertainty. Keep versioned procedures and staff training records. An auditor will inspect evidence, not promises. I have seen teams overvalue a perfect certificate and undervalue poor sample preparation. That choice can distort an otherwise strong system.
Tips: Build a weighted matrix before requesting quotations. Give accuracy and detection limit separate scores. Require at least three replicate tests using difficult samples. Check service response times and spare-part availability. Leave space for uncertainty; it is often estimated too optimistically. Recheck the matrix after a pilot run, because laboratory conditions rarely match the sales demonstration.