What Are the 2026 Top Water Technologies for Buyers?
In 2026, water buyers will face a practical question: which technologies solve real problems reliably?
The strongest options will combine measurable efficiency, resilient design, and transparent operating costs.
Smart meters can reveal hidden leaks within hours, rather than after a damaging monthly bill.
AI-supported monitoring may also predict pump failures, although poor data can produce misleading alerts.
That limitation matters.
Dr. Peter Gleick, co-founder of the Pacific Institute, has stated, “Water is a human right.”
His view places technology within a wider responsibility: improving access, safety, and long-term resource security.
For commercial facilities, municipalities, and industrial sites, leading water technologies may include membrane filtration, advanced oxidation, desalination, and decentralized water reuse.
Digital twins can model treatment performance before buyers approve expensive infrastructure.
Sensors can track turbidity, pressure, conductivity, and chemical changes across a facility.
The details become visible.
However, no technology deserves purchase because it appears innovative.
Buyers should examine energy consumption, maintenance skills, replacement parts, cybersecurity, and local water quality.
A compact reuse system may perform well in one building but struggle elsewhere.
A sophisticated platform may also overwhelm teams with unnecessary data.
That is an uncomfortable possibility.
The most credible 2026 decisions will compare pilot results, lifecycle costs, supplier transparency, and independently verified performance.
Experience remains essential.
Technology can improve water security, but only when people operate it carefully and review its weaknesses honestly.
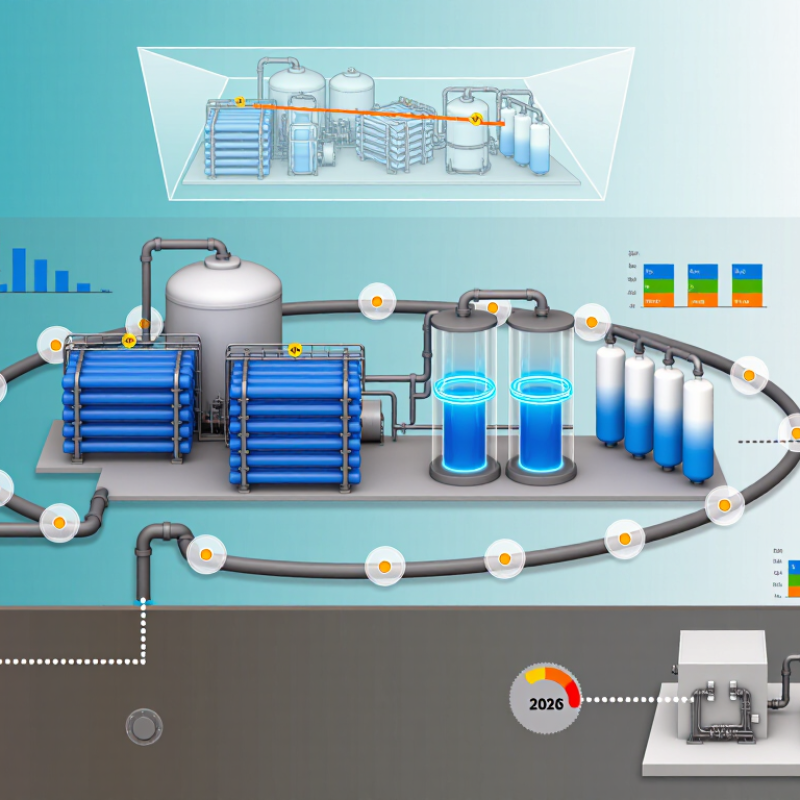
Assess 2026 Water Risks: 2.2 Billion Lack Safely Managed Water (WHO)
WHO reports that 2.2 billion people still lack safely managed drinking water. This figure should change how buyers judge water technology in 2026. Not enough. A device may produce clear water while missing pathogens, chemicals, or harmful metals. Safely managed water also requires reliable access, nearby availability, and protection from contamination.
Buyers should match technology to local evidence, not marketing claims. Membrane filtration can reduce many dissolved pollutants. Ultraviolet treatment can target microorganisms when the water is already clear. Smart sensors can track pressure, turbidity, flow, and possible leaks. Modular treatment systems may help remote facilities respond faster. However, every option needs regular maintenance, trained operators, replacement parts, and independent laboratory testing.
The purchasing process should begin with source-water analysis. Ask what happens during outages, floods, heatwaves, and supply delays. Check energy demand, wastewater handling, cybersecurity, and total operating cost. Low-cost equipment can become expensive when filters are unavailable. High-tech monitoring can also fail if nobody reviews the data. That weakness deserves attention. In practical assessments, simple alarms and clear maintenance schedules often outperform complicated systems. Buyers should demand transparent performance records, realistic service plans, and evidence from comparable conditions. No technology is perfect. Water safety depends on the whole system, not one impressive machine.
Compare Reverse Osmosis: Membranes Remove Up to 99% of Dissolved Salts
Reverse osmosis remains one of the leading water technologies for 2026 buyers. Its semi-permeable membranes can remove up to 99% of dissolved salts, depending on water quality and system design. This makes RO useful for reducing sodium, chloride, sulfate, and many other dissolved impurities. However, “up to 99%” is not a universal result. Feed pressure, temperature, membrane condition, and maintenance all affect performance.
In practical use, untreated water usually passes through sediment and carbon filtration first. These stages protect the RO membrane from particles, chlorine, and organic matter. The membrane then separates purified water from concentrated wastewater. A household system may improve taste and clarity, but buyers should request independent test data before trusting performance claims. A certified laboratory report is more useful than a sales promise. I have seen systems perform well during installation, then decline because filters were ignored. That part is easy to underestimate.
Tips: Test your source water before choosing equipment. Check salt rejection, flow rate, wastewater volume, and replacement costs. Ask how often membranes and prefilters need changing. Keep a simple maintenance record. Small details matter. RO also removes beneficial minerals, so consider remineralization when taste or dietary needs make it appropriate. Never assume one configuration fits every building, especially where well water contains iron, hardness, or biological contamination.
What Are the 2026 Top Water Technologies for Buyers?
Comparing typical upper-end dissolved-salt and total dissolved solids (TDS) reduction performance
Reverse osmosis membranes typically remove about 95–99% of dissolved salts, making RO one of the leading technologies for desalination and high-TDS water treatment. Distillation can achieve comparable or higher removal, while nanofiltration and electrodialysis provide moderate-to-high reduction depending on water chemistry, operating conditions, and system design. Conventional filtration and activated carbon are mainly used for particles, chlorine, taste, and odor rather than dissolved salts.
Values are representative engineering ranges for treated water and are not performance guarantees. Actual results vary with feed-water composition, membrane type, pressure, temperature, recovery rate, and pretreatment.
Evaluate Water Reuse: Over 80% of Global Wastewater Goes Untreated (UN-Water)
What Are the 2026 Top Water Technologies for Buyers?
Over 80% of global wastewater goes untreated, according to UN-Water and UNEP reports. That figure exposes a major reuse opportunity. Buyers should assess treatment systems beyond clean-looking discharge. The real question is simple: Can the water safely serve another purpose? Advanced biological treatment, membrane filtration, ultraviolet disinfection, and real-time sensors can support reliable reuse. However, each system has operating costs, energy demands, and maintenance risks.
The World Bank’s Wastewater: From Waste to Resource report identifies treated wastewater as a potential resource for agriculture, industry, and urban services. For buyers, source separation can improve results. Lightly contaminated process water may need less treatment than sewage. This can reduce energy use and chemical consumption. Membrane systems offer strong polishing, yet concentrate disposal remains difficult. No technology removes every trade-off. That part deserves more scrutiny.
Tips: Test the incoming water before choosing equipment. Review three years of flow and contamination data. Ask suppliers for measured removal rates, energy use, and maintenance records. Include seasonal changes in your calculations. WHO guidance supports risk-based water safety planning, not trust in one treatment step. Pilot testing is wise, although it can feel slower and more expensive. A small pilot may reveal scaling, fouling, or sensor errors before full investment.
Measure Smart Networks: Non-Revenue Water Often Exceeds 30% Worldwide
Non-revenue water often exceeds 30% worldwide, especially in aging or rapidly expanding networks. It includes leaks, meter errors, theft, and unbilled authorized use. Every lost cubic meter increases treatment costs, energy demand, and pressure on limited supplies. Buyers in 2026 should treat water loss as a measurable operational risk, not merely an infrastructure problem.
Smart water networks combine advanced meters, pressure sensors, acoustic devices, and cloud-based monitoring. District metered areas can compare inflow with customer consumption each day. Unusual night flows may reveal a hidden pipe break. Sudden pressure changes can identify valve failures or weak sections. Artificial intelligence can rank alerts, but field crews still need to verify them. Data is useful only when it supports timely decisions.
Choose systems that use open data standards and provide clear maintenance records. Cybersecurity, calibration, battery life, and local technical support deserve equal attention. A dashboard alone will not reduce leakage. Crews need training, spare parts, and permission to act quickly. No model is perfect. False alarms happen, and some small leaks remain invisible for months. Buyers should test technologies in one district before expanding them, measuring water recovered, response time, and total operating cost. That practical evidence is often more reliable than impressive demonstrations.
Select Low-Carbon Desalination: Reverse Osmosis Uses 2.5–4.5 kWh/m³
For 2026 buyers, low-carbon desalination deserves close attention. Reverse osmosis typically uses 2.5–4.5 kWh per cubic meter of water. This range is practical, but not universal. Salinity, temperature, recovery rate, and system pressure can change actual consumption. Seawater usually requires more energy than brackish water. Buyers should request operating data from comparable sites, not rely only on laboratory figures.
A reliable assessment begins with feedwater testing. Salinity, turbidity, temperature, and organic content affect membrane performance. Effective pretreatment reduces fouling and protects long-term efficiency. Energy-recovery equipment can capture pressure from the reject stream and return it to the process. Operators should monitor kWh per cubic meter, recovery rate, cleaning frequency, and membrane replacement intervals. These measurements reveal performance more clearly than a polished proposal. Small errors in feedwater assumptions can create large energy costs.
Purchasing teams should compare complete life-cycle impacts, not electricity alone. Include pumping, pretreatment, maintenance, replacement parts, and brine management. Carbon calculations should identify the electricity source and measurement boundary. Renewable power may reduce operational emissions, but equipment manufacturing still matters. There is no perfect number. Some project estimates remain too optimistic. In practice, buyers need transparent testing, independent verification, and performance guarantees tied to real operating conditions. A slightly higher initial cost may be reasonable when it delivers stable output and lower energy demand over many years.
What Are the 2026 Top Water Technologies for Buyers? – Select Low-Carbon Desalination: Reverse Osmosis Uses 2.5–4.5 kWh/m³
| Technology | Best-Fit Feedwater | Typical Energy Demand | Energy Type | Typical Water Recovery | Indicative Direct Operational Emissions* | Key Buyer Advantages | Primary Trade-Offs |
|---|---|---|---|---|---|---|---|
| Seawater Reverse Osmosis (SWRO) | Seawater and high-salinity coastal sources | 2.5–4.5 kWh/m³ | Electricity | 35–50% | 1.0–1.8 kg CO₂e/m³ | Lowest-energy mature option for seawater; modular; compatible with renewable electricity and energy-recovery devices | Requires extensive pretreatment; produces concentrated brine; performance is sensitive to fouling and feedwater quality |
| Brackish Water Reverse Osmosis (BWRO) | Brackish groundwater, inland salinity, and industrial process water | 0.5–2.0 kWh/m³ | Electricity | 60–85% | 0.2–0.8 kg CO₂e/m³ | Lower pressure and energy demand than seawater RO; high recovery potential; scalable for municipal and industrial use | Concentrate disposal can be difficult inland; dissolved silica, hardness, and fouling may require additional treatment |
| Electrodialysis / Electrodialysis Reversal (ED/EDR) | Low-to-moderate salinity brackish water and selected industrial streams | 0.5–2.5 kWh/m³ | Electricity | 70–95% | 0.2–1.0 kg CO₂e/m³ | Efficient for ionic removal at moderate salinity; polarity reversal helps control scaling; can selectively remove some ions | Less suitable for seawater-strength salinity; does not remove all neutral contaminants or microorganisms without complementary treatment |
| Nanofiltration (NF) | Hard water, sulfate removal, color reduction, and water softening | 0.3–1.5 kWh/m³ | Electricity | 70–90% | 0.1–0.6 kg CO₂e/m³ | Lower pressure than RO; effective for hardness and divalent ions; useful as RO pretreatment | Does not provide the same level of desalination as RO; concentrate management remains necessary |
| Multi-Effect Distillation (MED) | Seawater where low-grade heat or cogeneration is available | 1.5–2.5 kWhₜₕ/m³ plus about 1.5–2.5 kWhₑ/m³ | Thermal energy plus electricity | 20–40% | Site-dependent; often lower when waste heat is genuinely available | Produces high-quality distillate; relatively tolerant of some feedwater variability; can use waste heat | Higher capital complexity and thermal losses; carbon performance depends strongly on the heat source |
| Multi-Stage Flash Distillation (MSF) | Very large seawater desalination facilities with dependable steam supply | 50–120 kWhₜₕ/m³ plus about 2.5–5.0 kWhₑ/m³ | Thermal energy plus electricity | 10–20% | Highly dependent on steam source; generally higher when fossil heat is used | Robust continuous operation; long operating history; suitable for large, integrated heat-and-power systems | High thermal demand, large footprint, and lower recovery than modern membrane systems |
| Ultrafiltration (UF) / Microfiltration (MF) | Surface water, wastewater reuse, and RO pretreatment | 0.05–0.30 kWh/m³ | Electricity | 85–98% | 0.02–0.12 kg CO₂e/m³ | Low energy consumption; removes suspended solids, turbidity, bacteria, and many particles; improves downstream RO reliability | Does not remove dissolved salts; membrane cleaning and residuals management are required |
| Advanced Oxidation and Activated Carbon | Potable reuse and industrial water containing trace organic contaminants | 0.10–0.60 kWh/m³, depending on process configuration | Electricity and treatment chemicals | Not normally expressed as desalination recovery | 0.04–0.24 kg CO₂e/m³ | Targets trace organics, taste-and-odor compounds, and difficult-to-degrade contaminants; strengthens multi-barrier treatment trains | Energy and chemical demand vary widely; it is a polishing technology rather than a standalone desalination process |
*Method note: Indicative direct operational emissions are calculated using approximately 0.4 kg CO₂e per kWh of electricity and exclude embodied carbon, construction, chemical production, concentrate disposal, and site-specific heat emissions. Actual performance depends on salinity, temperature, pretreatment, recovery, pressure, water quality targets, and the local energy mix. Energy figures are typical planning ranges rather than guaranteed plant performance.
Related Posts
-
Why Are Water Technologies Important for Global Buyers?
-
What Are Water Technologies and How Do They Work?
-
What Are the Best Water Treatment Supplies in China?
-
China Top 10 Water Treatment Supplies Manufacturers
-
How to Choose a Drinking Water Treatment System?
-
What Is Water Treatment and How Does It Work?
Ready to talk about water treatment?
Contact us
Please complete this form and we will be in touch